|
5. Screen shots | 5.1 Fold-change reporting | 5.2 Save/Restore GUI parameters | 6. Help | 7. About Figures: 1 | 2 | 3 | 4 | 5 | 6 | 7 | 8 | 9 | 10 | 11 | 12 | 13 | 14 | 15 | 16 | 17 | 18 | 19 | 20 | 21 | 22 | 23 | 24 |
The SearchGui program is a subset of the HTMLtools Java program. For details, see the full HTMLtools reference manual ReferenceManual.html.
     java -Xmx256M -classpath .;.\searchGui.jar HTMLtools -searchGui
or
     java -Xmx256M -jar SearchGui.jar
or
     java -Xmx256M -classpath . -jar SearchGui.jar
In the above example, the memory specified is 256 megabytes. The first line was
put into a Windows .BAT file (SearchGUI.bat)
that can be run by clicking on this batch file. (Rename distributed
SearchGUI-bat file to SearchGUI.bat). It may also be
started using the construction shown in the 2nd and third lines.
Notice that the -Xmx256M specification is available to increase or decrease
the amount of memory used. The default memory may vary on different
computers. So you can use the script for force it the program to
start with more or less memory if you run into problems.
You also need to select the set of samples to use by selecting one or more Experiment Groups (see the Jak-Stat Prospector Web site for details on Experiment Groups). In the 2. Select one or more 'Sample Experiment Groups' window, selecting ALL is the default and will select all 18 arrays. You can click on individual Experiment Groups. To select a range, click on the first one that starts the range and then hold the SHIFT key and click the end of the range. To select non-adjacent Experiment Groups, hold the CONTROL key as you select different groups. Pressing the Reset button, will clear these two windows.

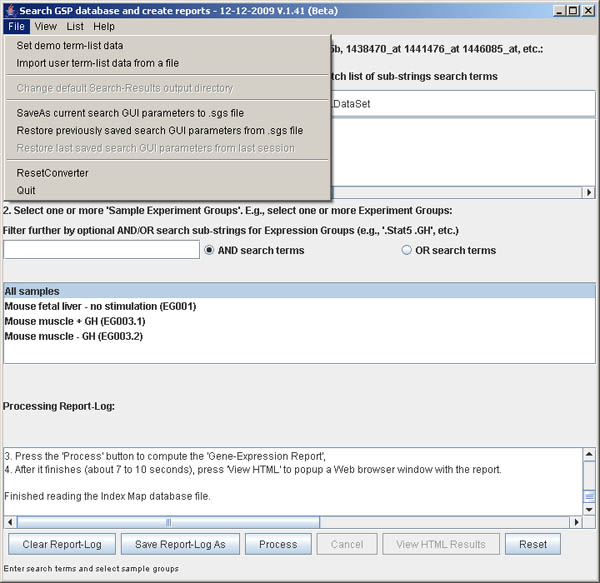
The File menu offers additional some data input options. You do not need to use any of these menu options to use the program. However, they can be useful for customizing your search results.
You can save the text output generated during processing that is shown in the 3. Processing Report Log scrollable text area at the bottom of the window. You can view a larger version of the Report-Log using the (View menu | Show big Report-Log window). Note that you can clear and save the log data (as a text file) using the buttons Clear report, and Save report as at the bottom of the windows.
You must specify a list of data search terms in the upper window 1. Enter list of Gene, Well ID or Probe ID.... The simplest way to specify these terms is to either cut and paste or type them into the window. To help demonstrate and simplify specifying the search terms, there are two commands in the File menu for setting the list: Set demo term-list data to enter a short list Stat5a Stat5b 1438470_at 1441476_at 1446085_at. The other is Import user term-list data from a file. The file can be a list of Genes or Feature IDs (probes) or Well IDs or any combination. Several example files are provided including data.search/LitRefGeneList.txt file, data.search/testGeneList.txt, and data.search/testFeatureIDList.txt. The first is a tab-delimited data with all 3 fields. The latter two examples just have lists of Genes or Feature IDs.
After you finish a search, you can perform another one. The File menu option: Reset converter or the Reset button at the bottom of the Window will reset the search specification. You can alternatively modify the existing search options and press the Process button again. During processing the View HTML Results button is disabled until processing is finished.
Figure S.2 This shows the menu options in the File menu.
This menu offers additional processing options described above.
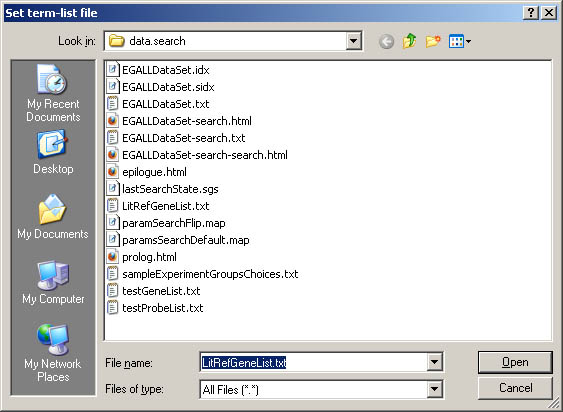
Figure S.3 This shows the pop up file browser for specifying a list
of gene/probes in a .txt file using the
(File | Import user term-list data from a file) menu option.
If the testGeneList.txt file was selected, the next figure shows the
new term-list.
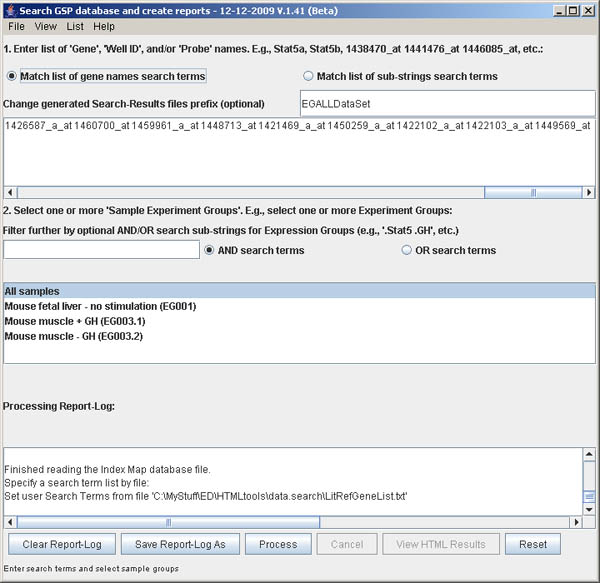
Figure S.4 This shows the new term-list specified from importing
the gene list from a file (previous figure)..
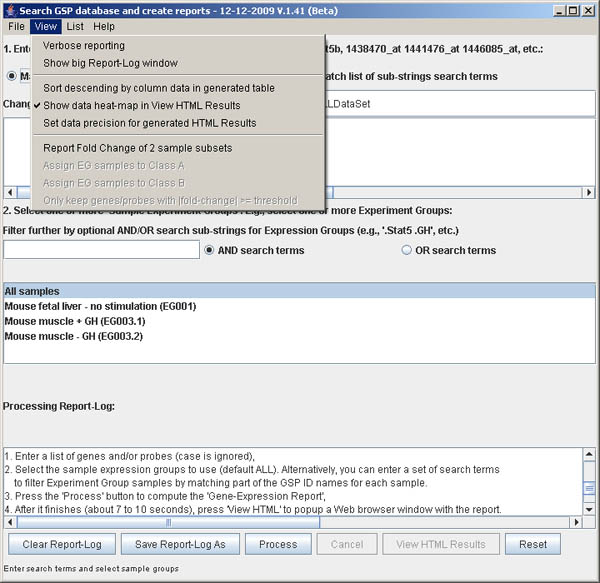
The View menu offers additional some data input
options. The menu Verbose reporting check box
could be enabled it you want to see the details on the search and
table generating as it progresses in the Report-Log window.
When the search results table is being generated, you can modify
it's presentation using other view options:
Sort descending by column data in generated table
(see Figure S.6 for more details).
The Show data heat-map in View HTML to show the generated results
table as a colored heatmap (see Figure S.14 for
an example) This is the default. Finally, Set data precision for generated
HTML to adjust the number of digits presented in the generated table
(0 sets it to no fraction, whereas the default -1 shows the full precision
of available in the data).
Figure S.5 This shows the menu options in the View menu.
This menu offers additional processing options described above.
Figure S.6 This shows the pop up query to let you define the sort name
to specify the generated table gene or gene probe ID column to be used for
the sort process. This will then use the gene expression data for the gene
probe you specified to sort the sample rows for the entire table. The default
is not to sort the data, but to use the sample order of the samples in the
expression groups you have specified. This pop up window is invoked from the
(View menu | Sort descending by column data in generated table).
Figure S.7 This shows dialog box (View menu | Set data precision
for generated HTML). The default is -1 which prints all digits available
in the generated HTML table. Setting it to 0, removes all fractions (used in
this example).
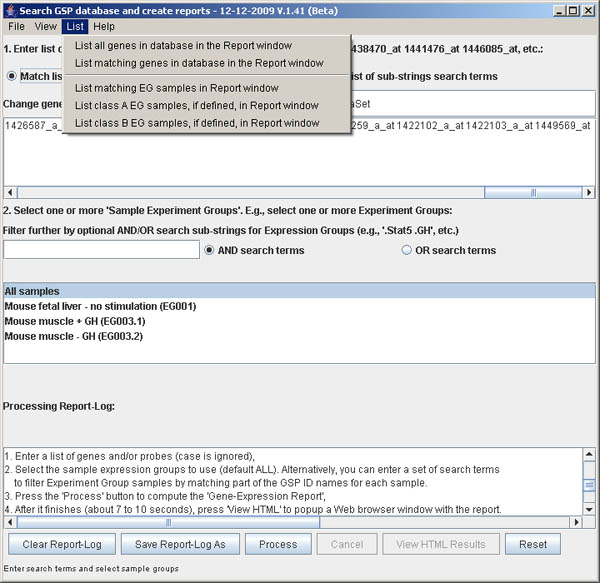
Figure S.8 This shows the menu options in the List menu.
You may list some of the data matching the gene/probe search terms or
EG sample search terms prior to doing the search. The first option is
to list all 45K gene/probe IDs. The second menu option lets you specify
gene/probe search terms either using the exact gene names or using matching
substrings. All genes/probes matching will be reported. The third through fifth
menus option lets you specify EG samples search terms either by using selected
EG groups from the list or using the EG filter terms. The latter is filtered
by a list of substrings that can be qualified as both being required (AND) or
either being required (OR) if the EG sample search terms are specified. The
forth and fifth list commands can be used to list the contents of the
class A and class B samples if they were assigned
(see Section 5.1 Adding fold-change statistics
to the generated report for more information on the classes of samples).
All lists are reported in the bottom scrollable Report Window.
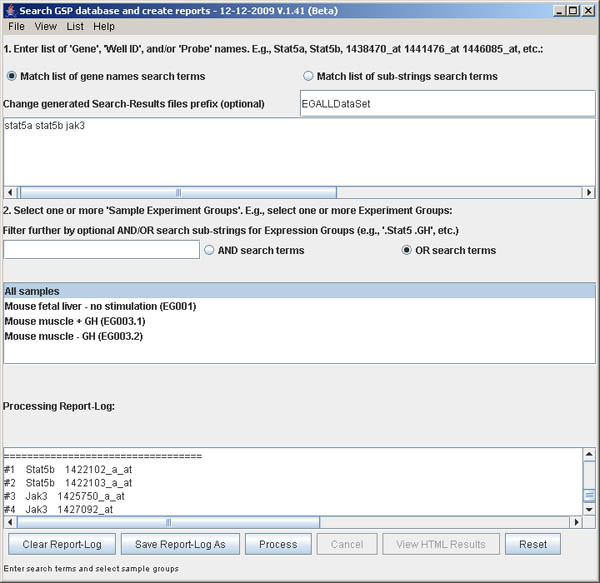
Figure S.9 This shows results from
List menu | List matching genes in database in the Report
window .
The genes/probes matching the string terms "stat5a" and "stat5b"
and "jak3" in the 45K probe database are listed in the scrollable
Processing Report log at the bottom of the window. The
radio button Match list of gene names search terms is set
to set an exact match. Alternatively, you can search for substrings
(e.g. "stat" "jak" to find all genes in these families) by setting
the radio button Match list of sub-strings search terms.
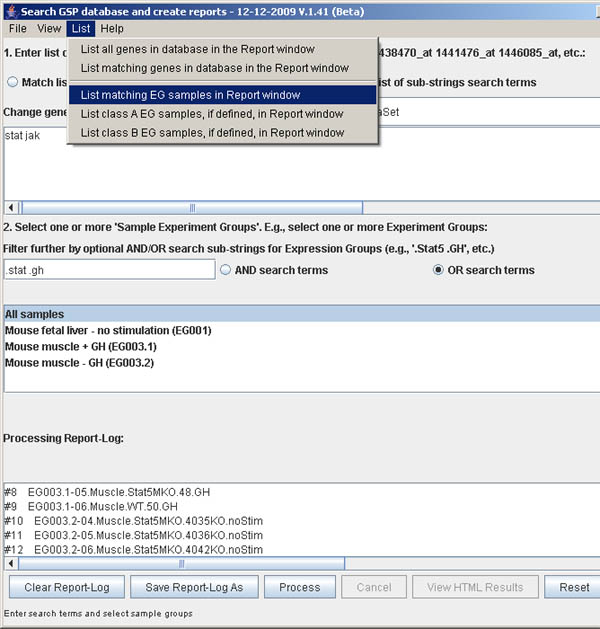
Figure S.10 This shows results from
List menu | List matching EG samples in database in the Report
window using the OR condition.
The Expression Group (EG) samples matching the substring terms
".Stat" or ".GT" in the 18 sample database are listed
in the scrollable Processing Report log at the bottom
of the window. It searches within the EG sample groups you have
selected. In this example, we have selected "All samples", but any
other subset could be used. Also, we required an OR
condition to select samples where either of the search terms
are present.
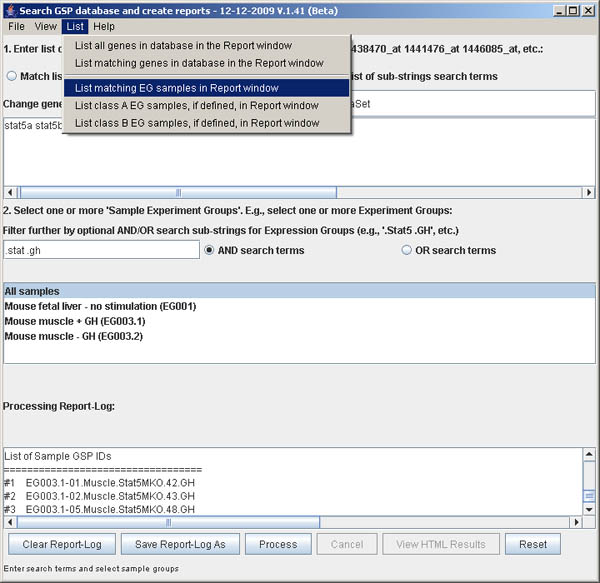
Figure S.11 This shows results from
List menu | List matching EG samples in database in the Report
window using the AND condition.
The Expression Group (EG) samples matching the substring terms
".stat5" and ".GH" in the 18 sample database are listed
in the scrollable Processing Report log at the bottom
of the window. It searches within the EG sample groups you have
selected. In this example, we have selected "All samples", but any
other subset could be used. Also, we are required an AND
condition to select samples where both search terms are present.
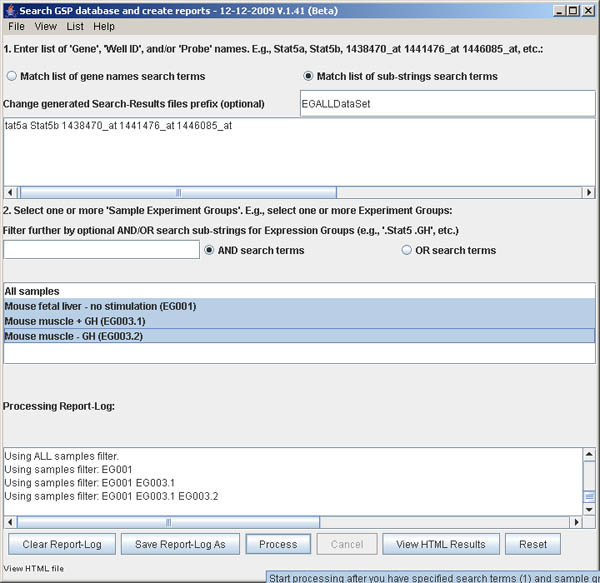
Figure S.12 This shows the Search window before processing
is finished and the Process button is made available. Pressing
it will start processing. This will typically take 7 to 10 seconds, so be
patient. Note that the Process and View HTML Results buttons are
disabled during processing and will be enabled after processing is completed.
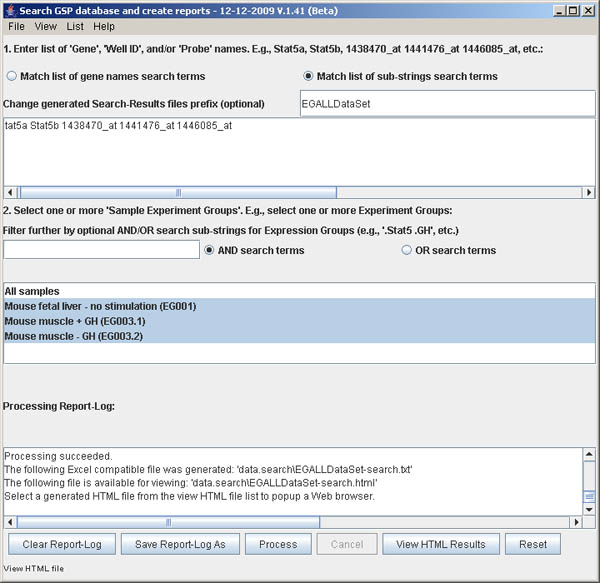
Figure S.13 This shows the Search window after processing
is finished and the View HTML Results button is made available. Pressing
it will pop up a local web browser with the data shown in the next
figure. Note that you can edit the parameters and press the Process button
again. You can clear the parameters using the Reset button.
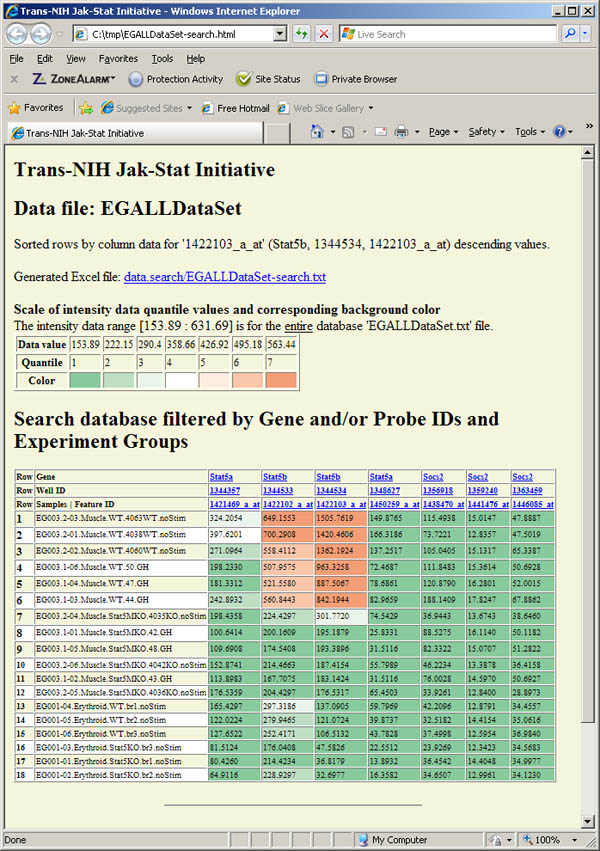
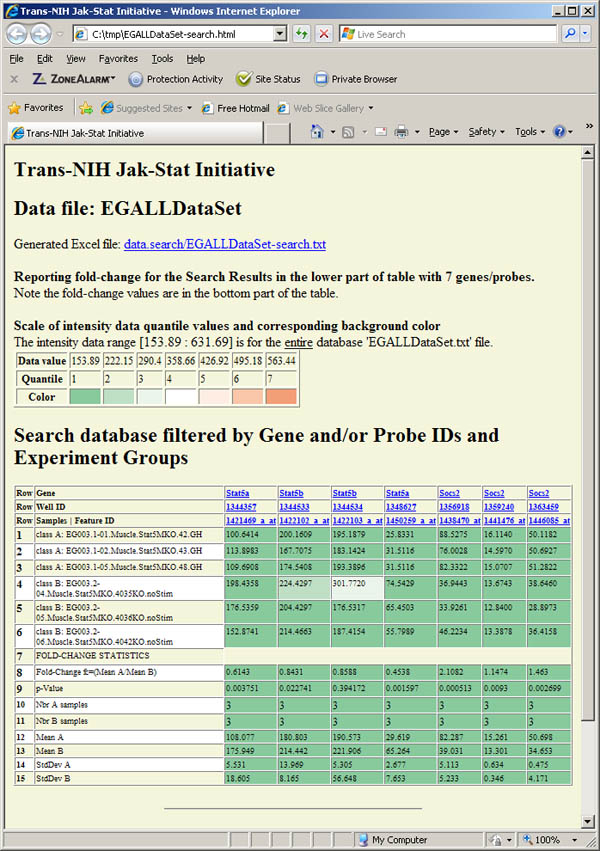
Figure S.14 This shows the generated table Web page created
by the above search and viewed when the View HTML Results button
was pressed. The colored cells reflect the quantiles that the data belong
to and are based on (max, min, mean, stddev) statistics computed over
the entire database. The data was sorted by the third probe (Stat5b/1422103_a_at)
and the numeric data was listed with no fractions to make it easier to "eyeball"
the data.
Figure S.16 This shows the report generated that includes the intensity data
followed by the fold-change and statistics for that data generated using the data
in the previous figure.
Figure S.17 This shows the menu options in the View menu after the
(View | Only keep genes/probes with |fold-change| >= threshold) option was enabled.
Note the two checkbox now visible with the command. It also pops up a parameter window
to enter the fold-change threshold to use (see Figure S.18). The generated filtered
fold-change report is shown in Figure S.19. The search-terms were reset to: the Jak-Stat
literature review genes; the EG samples are reset to EG003.1 Stat5MKO+GH for class A,
EG003.2 Stat5MKO-GH for class B; and the fold-change threshold was set to 1.6X.
Figure S.18 This shows the fold-change threshold parameter window
that pops up when the View menu after the
(View | Only keep genes/probes with |fold-change| >= threshold) option was enabled
(see Figure S.17). The fold-change threshold was set to 1.6X. If the filter threshold is 0
or less, no fold-change filtering is performed. The resulting generated filtered
report is shown in Figure S.19.
Figure S.19 This shows the filtered fold-change report generated that includes
the intensity data followed by the fold-change and statistics for that filter threshold
data specified in the previous figures S.17 and S.18. Of the 55 genes/probes in the
original table, 7 were kept that passed the filter and 48 were removed.
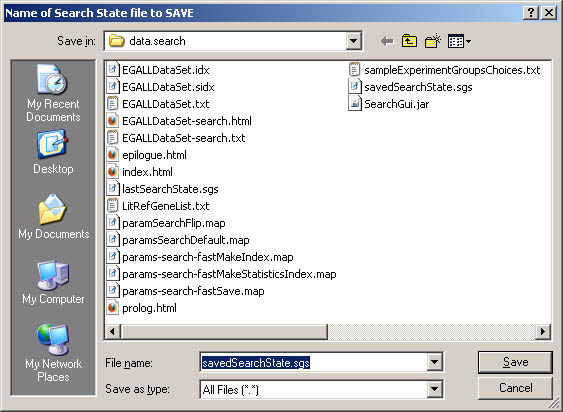
Figure S.21 This shows the popup directory for saving the state
to a .sgs file using the (File menu | SaveAs current search GUI parameters
to .sgs file) option described above.
Figure S.22 This shows the popup directory for restoring the state
from a .sgs file using the (File menu | Restore previously saved search GUI parameters from .sgs file) option described above.
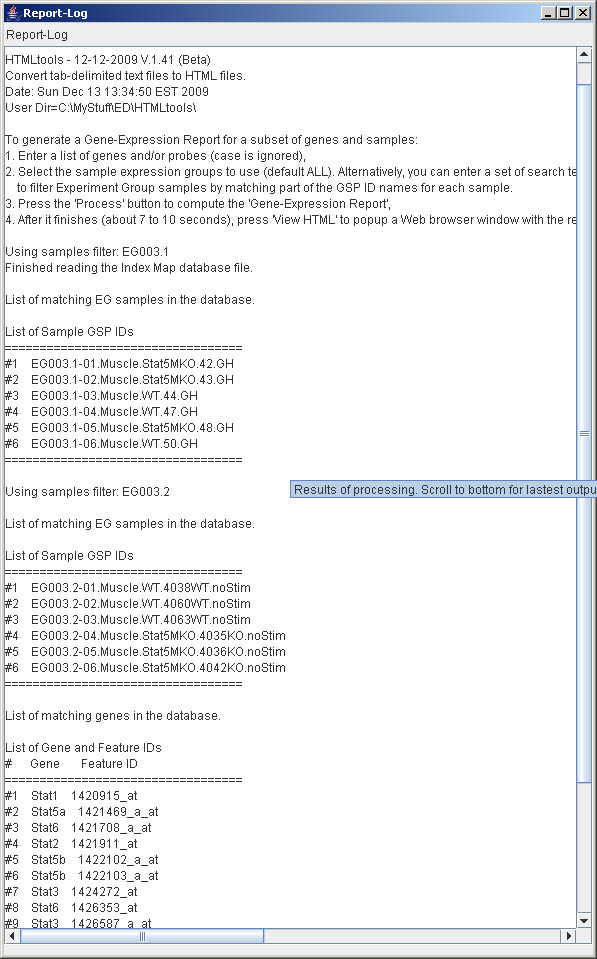
Figure S.24 This shows a larger version of the Report-Log using the
(View menu | Show big Report-Log window) to pop up a separate resizable
window. It is useful if you want to see more of the Report-Log. When you close it,
it minimizes it. Use the menu command again, to bring back.
This CvtTabDelim2HTML software code is available at the HTMLtools project on
SourceForge at
http://htmltools.sourceforge.org/
under the "Common Public License Version 1.0"
http://www.opensource.org/licenses/cpl1.0.php.
It has been released with a small non-proprietary sample data currently
publicly available on NCBI GEO to demonstrate some of the aspects of the
software.
Parts of this program was derived and refactored from the open source
MAExplorer (http://maexplorer.sourceforge.org/), and
Open2Dprot (http://Open2Dprot.sourceforge.net/) projects.
Software Copyright 2008, 2009 by Peter Lemkin
E-Mail: lemkin@users.sourceforge.net
http://lemkingroup.com


5.1 Adding fold-change statistics to the generated HTML report
The procedure used to compare the mean value fold-change of the Stat5 subsets for the
specified genes (we used the demo set of genes/probes) for the two sets of
sample EG003.1 (Stat5KO+GH) and EG003.2 (Stat5KO-GH), called classes A and B
here and in the SearchGUI menus and report. Fold-change is computed as the
(mean A)/(mean B) for each gene/probe which is then reported in the extended
report table.
Procedure
The generated HTML and .txt files are attached in this email. Note that the
fold-change results are appended to the regular table and the the class A and class
B samples have those identifiers prefixed to their sample names. Note that the
fold-change report is in the second half of the report with the statistics reported
being computed on the column data for each gene/probe. Note: Sorting is can't be
enabled if generating the fold-change report data since it would cause problems with
the reporting format.
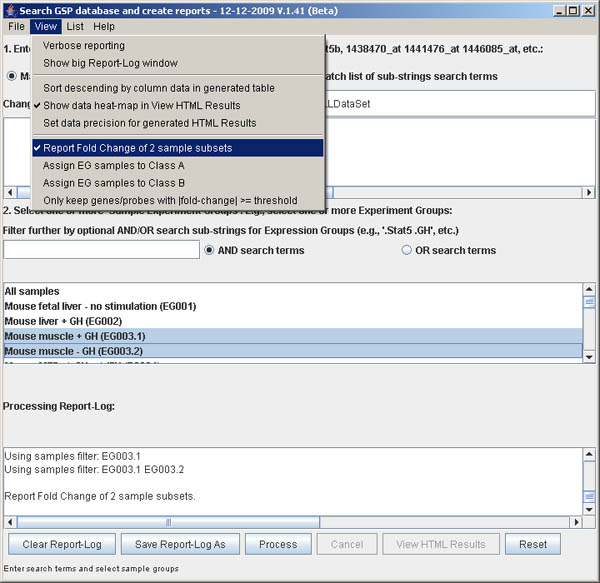
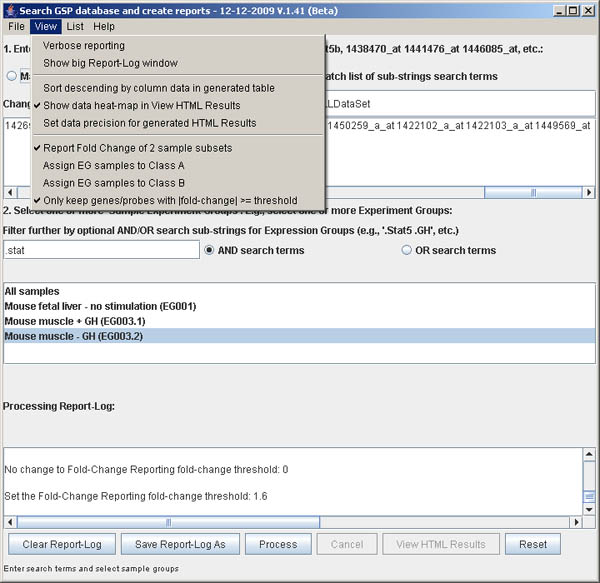
Figure S.15 This shows the menu options in the View menu after
the (View | Report Fold Change of 2 sample subsets) option was enabled.
Note the two new commands that are activated: Assign EG samples to Class A and
Assign EG samples to Class B. Class A is "Stat5MKO+GH" and class B is
"Stat5MKO-GH". The demo set of genes/probes was used.
e.g., set 2. filter sample search term to ".stat", select EG003.1 in the scrollable
list, then select
(View menu | Assign EG samples to Class A) to define class A samples
e.g., set 2. filter sample search term to ".stat", select EG003.2 in the scrollable
list, then select
(View menu | Assign EG samples to Class B) to define class B samples.


5.2 Save/Restore the GUI parameters from files
The SearchGUI program lets you save the current GUI parameters you have
into a file with an ".sgs" (SearchGui State) file extension. In addition,
it saves the last set of parameters you used when you exited the program in a
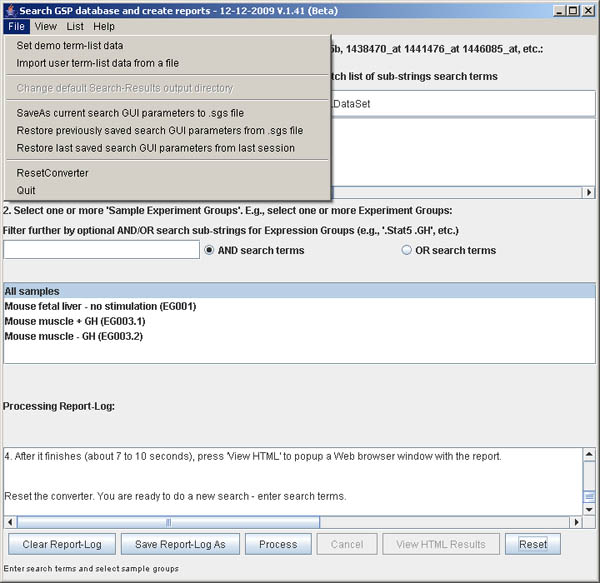
special "lastSearchState.sgs" file. Figure S.20 shows the three options for: a)
saving the state
(File menu | SaveAs current search GUI parameters to .sgs file); and
b) and restoring it with either
(File menu | Restore previously saved search GUI parameters from .sgs file)
or
(File menu | Restore last saved search GUI parameters from last session).
The pop up file selection menus are shown in Figures S.21 and S.22.
Figure S.20 This shows the menu options in the File menu.
This menu offers additional processing options described above.

6. Help
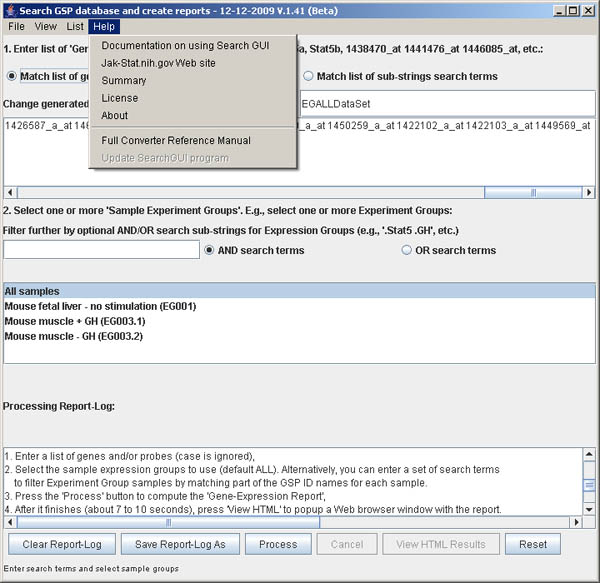
There are several Web pages that contain the documentation in the Help menu
in Figure S.23. You can view a larger version of the Report-Log shown in Figure S.24.
Figure S.23 This shows the menu options in the Help menu.
This menu offers additional processing options described above. The
primary documention (this document) is the first entry Documentation on
using the Search GUI.
7. ABOUT - OPEN SOURCE COPYRIGHT
The original data set was proprietary created for the Group STAT Project (GSP)
and was created along with the original conversion program, CvtTabDelim2HTML,
to support the NIH Jak-Stat
Prospector Web site that is part of the Trans-NIH Jak-Stat Initiative
(http://jak-stat.nih.gov/)
accessible through the the Prospector link. This Web site is open to
the public with the mouse data.
Revised: Dec 12, 2009